“Ongelijkheid in België: Welke Politieke Voorstellen Liggen op Tafel?” is fundamentally a question about who should contribute more, who should receive more protection, and whether employment reforms reduce poverty or deepen insecurity.
Belgium is often viewed as comparatively equal because its taxes, wage-indexation system and social security system redistribute income extensively. Yet that does not mean inequality has disappeared. The debate now focuses on wealth, access to work, housing costs, regional gaps and the changing terms of unemployment and pensions.
For Indian readers following European policy, Belgium is a useful case study: it combines a strong welfare state with high labour taxes, a multilingual federal structure, and substantial differences between prosperous and less prosperous regions.
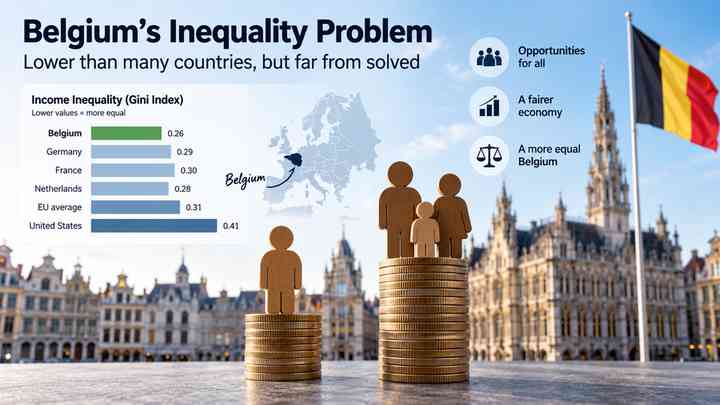
Belgium’s inequality problem: lower than many countries, but far from solved
The latest official data for 2024 show that 18.3% of Belgium’s population—just over 2.1 million people—were at risk of poverty or social exclusion. The monetary-poverty rate stood at 11.4%.
Income inequality is relatively contained after taxes and transfers. Belgium’s Gini coefficient, where a lower number indicates more equal disposable incomes, was 24.6 in 2024. The richest fifth of the population received around 3.5 times the income of the poorest fifth.
However, these averages can conceal serious divides:
- Brussels and parts of Wallonia face higher poverty and lower employment than Flanders.
- People with disabilities, migrants, low-qualified workers and single-parent households often face greater financial risk.
- Housing shortages and long waiting lists for social housing intensify inequality in major cities.
- Wealth is much more concentrated than income, especially financial assets and business ownership.
- School outcomes remain strongly linked to family background, making inequality harder to escape across generations.
That is why Belgian political proposals do not centre on one policy alone. They span taxation, jobs, unemployment benefits, pensions, public services, education and housing.
The federal government’s central approach: make work pay more
The current federal coalition’s approach is built around a simple principle: people should see a clearer financial gain from taking up work or staying employed.
Its tax-and-work package includes a gradual increase in the tax-free income allowance and a reform of the special social-security contribution. The government has said that single people could receive up to €365 more net income per year from the contribution reform, while the overall tax measures are intended to leave people in work with an average of roughly €100 extra net income per month by 2029.
Supporters argue that Belgium taxes labour heavily and that reducing this burden can improve employment, especially for lower and middle incomes. This matters because employment remains uneven across regions and groups. Flanders faces labour shortages, while Brussels and Wallonia have lower employment rates.
Critics make two important points. First, a tax cut only helps those already in paid work; it does not automatically solve poverty among people unable to find suitable jobs or unable to work. Second, the long-term impact depends on how the government finances lower labour taxes without weakening public services or income support.
The policy therefore targets inequality through labour-market participation rather than primarily through redistribution after income is earned.
A two-year limit on unemployment benefits

One of the most consequential recent reforms is the limitation of full unemployment benefits to a maximum of 24 months. The new rules took effect on 1 March 2026.
The structure consists of a 12-month base period, with up to 12 additional months depending on an individual’s employment record. Insertion benefits for people entering the labour market after studies are also limited to a maximum of one year. Transitional rules apply to some people who were already receiving benefits before the new system began.
Why supporters back the reform
Proponents say Belgium’s earlier system could keep people separated from the labour market for too long. They argue that a time limit, combined with employment support, training and placement services, can encourage faster job matching and increase participation.
The case is strongest where vacancies exist but workers lack incentives, information or skills to move into available jobs.
Why opponents are concerned
The risk is that a deadline transfers people from unemployment insurance to municipal social assistance without creating stable employment. That concern is especially relevant in areas with fewer vacancies, for people with health conditions, and for jobseekers facing discrimination or care responsibilities.
Whether this proposal reduces inequality will depend less on the two-year limit itself and more on the support surrounding it: accessible training, childcare, disability inclusion, transport, language support and real jobs with sustainable pay.
Capital gains tax: a shift towards taxing investment returns
For many years, Belgium’s treatment of private capital gains was a major issue in the fairness debate. The federal government has proposed a broad tax on capital gains from financial assets, including crypto-assets.
The draft framework approved by the Council of Ministers set out:
| Element | Proposed framework |
|---|---|
| Standard tax rate | 10% on capital gains |
| Annual allowance | €10,000, indexed; potentially up to €15,000 under conditions |
| Losses | Same-year losses may be deducted |
| Large shareholdings | Special treatment for taxpayers holding at least 20% of a company |
| Large-shareholding allowance | First €1 million of gains exempt over five years, followed by progressive rates from 1.25% to 10% |
The proposal was designed to take effect from 1 January 2026, subject to the required legislative process and final legal rules.
This is politically significant because it acknowledges the difference between income from work and income from assets. Wage earners may pay tax and social contributions throughout their careers, while investment gains can be treated more favourably.
Supporters see a capital-gains tax as a modest correction that can help finance labour-tax relief. Critics worry about complexity, effects on entrepreneurship and the possibility that investors could move assets abroad. The policy challenge is to tax gains fairly while protecting ordinary long-term savers and avoiding loopholes for the wealthiest households.
Wealth-tax proposals from the left and green parties

The government’s capital-gains approach is much narrower than proposals from Belgium’s left-wing and green parties.
The Workers’ Party of Belgium (PTB/PVDA) supports a recurring tax on large net fortunes. Its proposal targets net wealth above €5 million, with a 2% rate on wealth above that threshold and a 3% rate above €10 million. The party presents this as a measure aimed at the top 1% rather than middle-class households, alongside stronger action against tax avoidance and financial secrecy.
Groen, the Flemish green party, has advocated a progressive levy on total net wealth, while leaving net wealth below €2.5 million untaxed. It also supports lowering taxes on work, narrowing the tax difference between labour income and capital income, addressing inheritance-tax avoidance, and strengthening action against tax havens.
The French-speaking Socialist Party (PS) has also argued that people who work should pay less tax while very wealthy households should contribute more. Its election platform included a tax on ultra-rich households with wealth of at least €1.25 million, excluding the main home and assets used for professional activity.
These proposals share a broad philosophy: inequality is not only about monthly income. It is also about accumulated assets, inheritance, access to investment income and the ability to structure wealth through companies.
Their opponents raise questions about valuation of privately held businesses, capital flight, administrative burden and whether a national wealth tax is workable in an open European economy. Those objections do not make wealth taxation impossible, but they show why policy design and international coordination matter.
Pensions: fairness between generations and career paths
Pension reform has become another major inequality issue. Belgium’s reforms increasingly reward longer effective careers while reducing the value of some non-working periods in pension calculations.
Changes scheduled from 2027 include tighter rules for early retirement and a pension penalty for certain people who retire early without meeting the new effective-work requirements. The existing pension bonus stopped accruing at the end of 2025, while a new bonus is being introduced for people who work beyond the statutory retirement age and meet additional conditions.
Some reforms protect people returning gradually to work after occupational injury or illness. Medical absences also receive more favourable treatment for the guaranteed minimum pension’s work requirement.
The fairness debate is clear. Supporters say pensions must reflect longer working lives and remain financially sustainable as the population ages. Critics argue that workers do not all have the same ability to extend their careers. A professional in a desk-based role and a worker in a physically demanding job may face very different realities at age 60.
A genuinely equal pension policy has to recognise caregiving, disability, sickness and unequal life expectancy—not merely years spent in formal employment.
Housing, education and public services: the less visible side of inequality

Tax policy attracts headlines, but Belgium’s inequality debate also turns on services people use every day.
Affordable housing is particularly important in Brussels and other high-demand cities. Long social-housing waiting lists can trap lower-income households in expensive or insecure private rentals. Regional and local governments therefore have a major role in housing supply, energy-efficient renovation and tenant protection.
Education is another pressure point. Socio-economic background remains closely connected to learning outcomes, and early tracking can reinforce existing gaps. Better early-years support, language assistance, tutoring, teacher capacity and affordable digital access can do more to reduce lifetime inequality than a single tax change.
Public transport, healthcare, childcare and energy-efficient homes also matter because they reduce essential household costs. A family’s living standard is shaped by both cash income and the quality, affordability and availability of public services.
Which proposals are most likely to reduce inequality?
There is no single winner. Each approach addresses a different part of the problem.
| Policy approach | Main potential gain | Main risk |
|---|---|---|
| Lower tax on work | Higher take-home pay and stronger job incentives | Benefits may bypass people outside work |
| Time-limited unemployment benefits | Faster re-entry into employment for some people | Greater hardship if support and jobs are inadequate |
| Capital-gains taxation | Fairer treatment of investment returns | Complexity and avoidance opportunities |
| Wealth tax | Directly targets concentrated assets | Valuation, enforcement and capital-mobility challenges |
| Pension reform | Improves long-term fiscal sustainability | Can disadvantage people with broken or demanding careers |
| Housing and education investment | Reduces structural inequality over time | Requires sustained public funding and delivery capacity |
The most credible strategy is likely to combine several tools: make employment financially worthwhile, protect people who cannot work, tax wealth and capital more consistently, and invest in the services that expand opportunity.
What Indian readers should take from Belgium’s debate
Belgium’s policy discussion shows that inequality cannot be judged only by average income or headline tax rates. A country may have strong social protection and still struggle with wealth concentration, regional inequality and unequal access to secure work.
The central question is not whether government should intervene, but how it should do so. Should the priority be lower taxes on work, higher taxes on wealth, tighter welfare conditions, more public investment—or a carefully balanced mix?
Belgium’s answer is still being negotiated through legislation, budgets and political conflict. The proposals on the table reveal a country trying to preserve social protection while adapting it to ageing, labour shortages, fiscal pressure and changing forms of wealth.
Frequently Asked Questions
What does “ongelijkheid België” mean?
“Ongelijkheid België” refers to inequality in Belgium, including gaps in income, wealth, employment, education, housing and access to public services.
Is Belgium an unequal country?
Belgium has comparatively low disposable-income inequality after taxes and social transfers, but poverty risk, wealth concentration and regional divides remain significant.
Are unemployment benefits now limited in Belgium?
Yes. Since 1 March 2026, full unemployment benefits are generally limited to a maximum of 24 months, subject to eligibility and transitional rules.
Does Belgium have a capital-gains tax?
Belgium’s federal government approved a draft framework for a broad capital-gains tax on financial assets, with a proposed 10% standard rate and annual allowances. Final applicability depends on the enacted legal framework.
What is the Belgian millionaire-tax proposal?
PTB/PVDA proposes a 2% annual tax on net wealth above €5 million and a 3% rate above €10 million, targeting large fortunes rather than typical households.
Why are housing and education part of the inequality debate?
They shape opportunity over a lifetime. Affordable housing reduces financial stress, while equal access to quality education improves employment prospects and social mobility.